What BAS Points Should You Trend? A Practical HVAC Troubleshooting Trend List

Choosing the right BAS points to trend can turn an HVAC complaint into evidence, but only when the related signals are viewed together. Room temperature alone rarely explains a warm space, and pump speed alone does not show whether the pump is responding correctly.
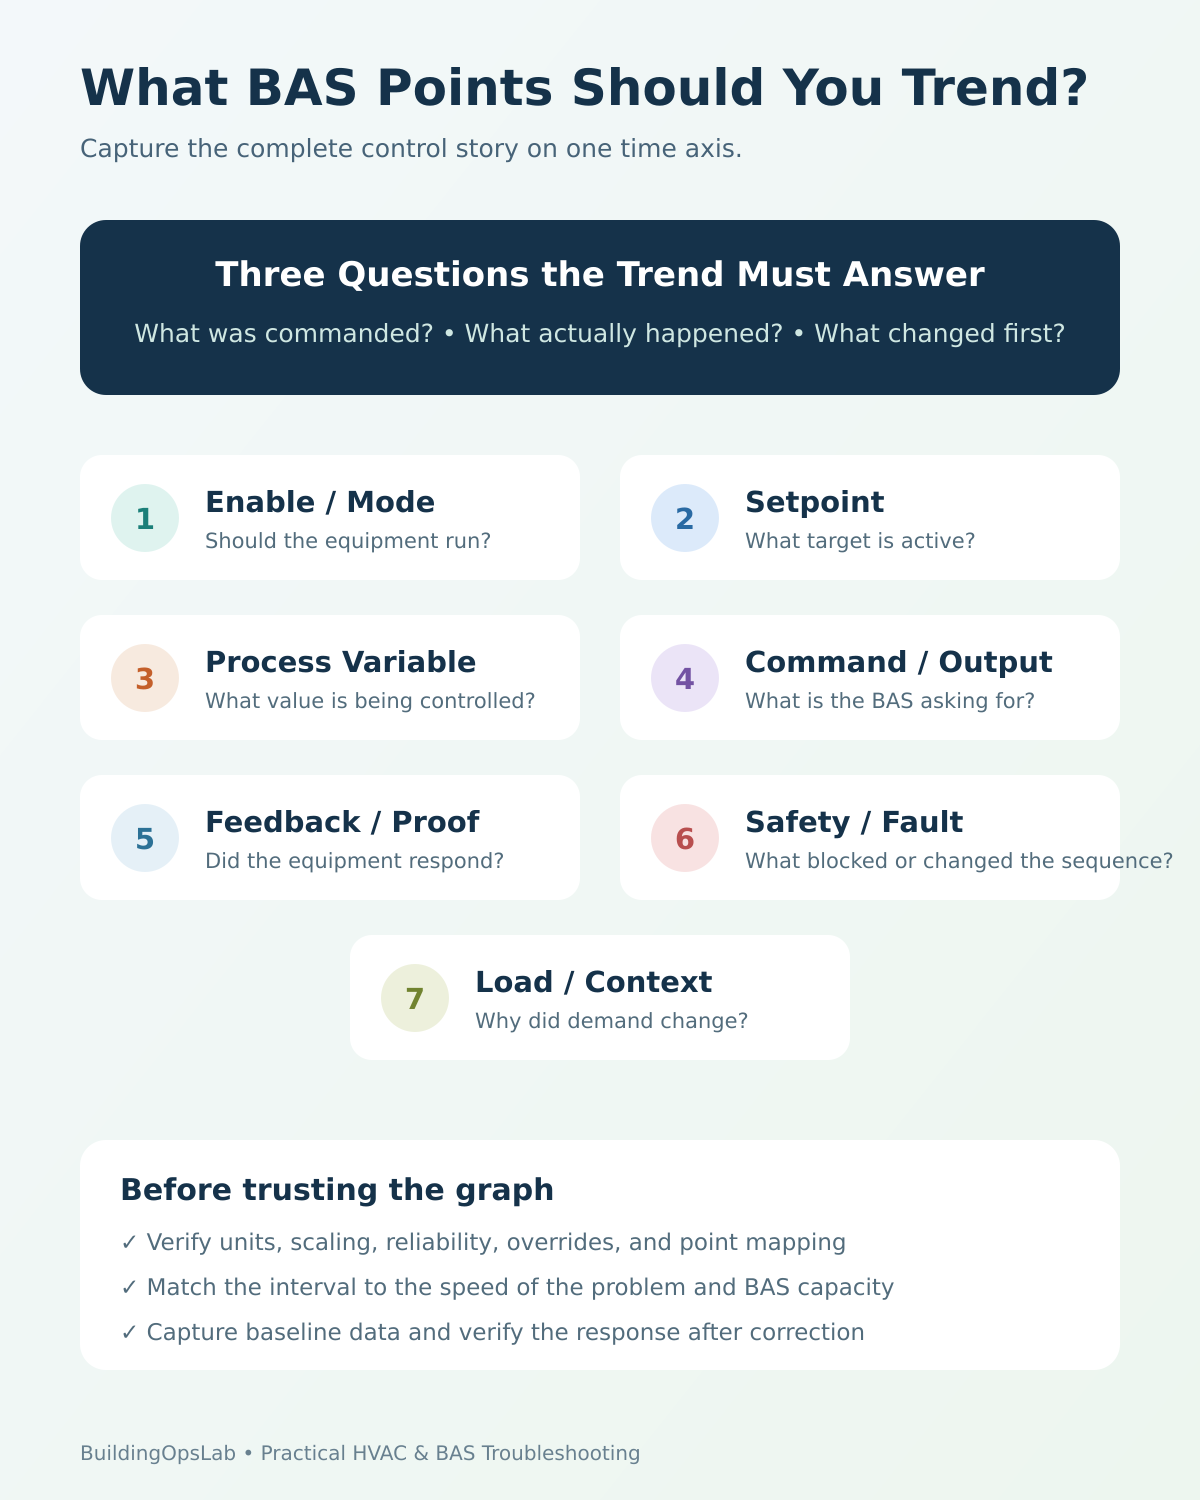
The goal is not to trend everything. The goal is to capture enough of the control story to answer three questions: What was the system trying to do? What did the equipment actually do? What condition changed first?
Quick Answer
For most HVAC control problems, build the trend around seven signal groups: enable/mode, setpoint, process variable, command/output, feedback/proof, safety/fault state, and load/context. Trend them on the same time axis. Then add equipment-specific points only when they help test a real hypothesis. This produces a much stronger diagnostic picture than collecting dozens of unrelated points.
In This Guide
- The Problem: Too Little Data or Too Much Data
- The Seven-Point BAS Trending Framework
- Practical Trend Lists by Equipment Type
- Trend Interval: Match the Resolution to the Problem
- How to Build a Troubleshooting Trend
- Before You Diagnose: Check the Trend Evidence
- Real-World Field Example: Heating Pump Hunting
- Common BAS Trending Mistakes
- Facility Manager Trend Requests That Are Actually Useful
- Technician Checklist
- Key Takeaways
- FAQ
The Problem: Too Little Data or Too Much Data
Two common BAS trending mistakes sit at opposite ends of the spectrum. The first is trending only the symptom: zone temperature, supply-air temperature, differential pressure, or one alarm point. The second is trending hundreds of points without deciding what question the data should answer. Both approaches create work without necessarily creating clarity.
PNNL’s building re-tuning guidance treats trend-data collection as a planned diagnostic activity: define the points, measurement period, interval, and units in advance. Current PNNL VAV O&M guidance also emphasizes relationships such as static pressure with fan control, damper position with zone temperature, and airflow with damper position.
The Seven-Point BAS Trending Framework
1. Enable or Operating Mode
Start by proving whether the equipment was supposed to run. Trend occupancy, schedule state, equipment enable, heating/cooling mode, lead/lag state, or other supervisory modes that change the sequence. Without this context, a command of 0% may look like a fault even when the unit was intentionally disabled.
2. Setpoint
Trend the target the controller is trying to maintain: supply-air temperature setpoint, duct-static setpoint, differential-pressure setpoint, zone temperature setpoint, airflow setpoint, or chilled-water setpoint. If the setpoint is being reset by another sequence, trend the reset value too.
3. Process Variable
Trend the measured value being controlled. Examples include actual supply-air temperature, duct static pressure, hydronic differential pressure, zone temperature, or VAV airflow. If the process variable is unreliable, drifting, or badly scaled, the controller can behave perfectly and still drive the equipment in the wrong direction.
4. Command or Controller Output
Trend what the BAS is asking for: VFD speed command, valve command, damper command, cooling-stage request, compressor enable, boiler enable, or pump command. This is the fastest way to separate a control decision from a mechanical response.
5. Feedback or Proof
A command is not proof. Trend actual VFD frequency, fan status, pump status, valve position feedback, damper feedback, current switch, flow proof, or other available response point. Command-versus-feedback comparison is one of the highest-value BAS troubleshooting techniques.
6. Safety, Fault, and Interlock State
Include the states that can block or change the sequence: freezestat, smoke shutdown, high/low pressure, drive fault, chiller alarm, loss of flow, filter alarm, low-temperature protection, or a general safety permissive. A sequence can look illogical if the interlock that changed it is not on the trend.
7. Load and Context
Add the external condition that explains why demand changed. Examples include outdoor-air temperature, return-air temperature, zone demand, valve population, critical VAV damper positions, occupancy, chiller load, or another pump staging. Context prevents normal load changes from being misdiagnosed as control instability.
Practical Trend Lists by Equipment Type
| Equipment | Core points to trend | Useful context |
|---|---|---|
| AHU | Supply fan command/status/speed; duct static actual/setpoint; SAT actual/setpoint; heating/cooling valve command; OAD command/feedback | OAT, RAT, MAT, occupancy, VAV demand, freezestat/smoke status |
| VAV | Zone temp/setpoint; airflow actual/setpoint; damper command/position; reheat command | Occupancy, discharge-air temp if available, upstream static pressure |
| Hydronic Pump | DP actual/setpoint; pump command; actual VFD speed; run status/fault | Lead/lag state, critical valve positions, system enable, bypass position if used |
| RTU | Cooling/heating demand; supply fan status; SAT/RAT/OAT; economizer command/position; cooling stages | Occupancy, compressor proof where available, safeties/alarms |
| Chiller Plant | CHWS/CHWR; chiller enable/status/alarm; chilled-water pump command/status/flow proof; condenser-water temperatures | Tower fan command/speed, condenser pump status, load, setpoint resets |
Trend Interval: Match the Resolution to the Problem
There is no responsible universal trend interval. PNNL re-tuning training describes 5- to 15-minute measurements for longer-term monitoring, while Johnson Controls notes that periodic Metasys sampling should generally be 60 seconds or greater when not using change-of-value logging. These are platform/use-case examples, not site-wide rules.
A fast PID hunting problem may need temporary higher-resolution data, while a weekly schedule problem does not need second-by-second logging. Match the interval to the behavior, platform capacity, buffer size, and required monitoring period.
Practical rule: The trend interval should be short enough to capture the event, but no shorter than necessary. Increase resolution temporarily for troubleshooting, then return to a sustainable long-term strategy.
How to Build a Troubleshooting Trend
Step 1 — Write the Question First
Examples: Why does the pump speed oscillate? Why does the AHU trip on low static? Why is the RTU not cooling even though the fan is running? Why did the schedule not start the equipment? The question determines the point list.
Step 2 — Put Cause and Response on the Same Time Axis
For a control loop, put setpoint, actual value, output command, and equipment feedback together. For a sequence, add enable/mode and the interlocks that can block the output. If one point is collected at a different time base or from a clock that is out of sync, sequence-of-events analysis becomes less reliable—another reason to verify BAS time synchronization.
Step 3 — Verify Units and Point Quality
Before trusting a graph, confirm engineering units, scaling, reliability, overrides, and whether the point is current. A beautifully plotted wrong sensor value is still wrong data. If the BAS graphic and raw point disagree, troubleshoot the mapping before using the trend as evidence.
Step 4 — Capture Before and After the Change
If you adjust a setpoint, repair a sensor, change a sequence, or reset a loop, keep enough data before and after the action to prove whether the system response improved. Commissioning is stronger when the correction is visible in the data.
Before You Diagnose: Can the Trend Support the Conclusion?
Use these checks before tuning a loop or replacing a component. A graph can show a relationship without establishing its cause.
1. Confirm what each trace actually records
Keep the exact object reference, units, source device, and whether the value is measured, commanded, or calculated. Two traces with different labels may still reference the same point. A calculated “running” flag that follows the command is not independent equipment feedback.
2. Check whether missing detail was never recorded
Note whether collection is periodic, change-of-value (COV), or triggered. Record the interval or COV increment and check for disabled logging, unreliable inputs, and gaps. A line drawn between sparse samples does not prove the equipment followed that path. A flat trace may reflect a stable value, a stale source, or a change smaller than the logging threshold.
Metasys 16.0 trend attributes document these collection settings and the buffer size. For that implementation, the guidance calls for periodic sampling of at least 60 seconds. If the event is faster than the supported collection rate, choose an approved diagnostic method instead of assuming that faster server logging is harmless.
3. Calculate how much history the local buffer can retain
For simple periodic sampling, approximate local coverage as record capacity × sample interval. A hypothetical 144-record buffer sampled every 60 seconds holds about 144 minutes (2 hours 24 minutes), not a full day. This arithmetic example is not a site measurement or a recommended configuration. COV logging, additional record types, stop-when-full behavior, and server archival can change actual retention. Verify transfer and retention before leaving the site.
4. Do not infer event order below the available resolution
If a command and a fault first appear in the same sample interval, the graph may not establish which occurred first. Check clock alignment and the device event log. Preserve original timestamps when comparing exports; do not silently fill missing samples with zero or describe interpolated values as measurements.
5. Define the before-and-after comparison
Record the change time, operating mode, active setpoint, and relevant load. Compare the same operating condition where practical. A stable pump after a reset during a different load does not by itself demonstrate a lasting tuning correction. Keep the follow-up period and any untested mode in the service record.
A useful conclusion names the next check
- Command changes; measured response does not: investigate the command path, local mode, equipment, and feedback source.
- Setpoint and response both move: examine the reset or staging sequence before blaming loop tuning.
- The trace has gaps or inconsistent timestamps: resolve data quality before assigning a cause.
Use the time-synchronization record when event ordering is uncertain, and the command-versus-response checks when displayed and physical states disagree.
Real-World Field Example: Heating Pump Hunting
In a real heating-pump case, the pumps were reported to be hunting. The investigation tested the VFD in the intended automatic condition, changed setpoint scenarios, and reviewed controller programming and BAS graphics while monitoring system response. A PID tuning/reset condition was identified. After the relevant reset, pump operation stabilized, and a site-specific daily reset was added to the control strategy. A separate Pump 1 speed graphic mismatch was also corrected.
The lesson is not that every hunting pump needs a daily PID reset—that was a site-specific corrective action. The broader lesson is that setpoint, process feedback, controller output, actual drive response, mode, and related sequence states need to be viewed together. That is the pattern a strong trend should capture.
Common BAS Trending Mistakes
- Trending only the symptom and not the command that created it.
- Trending command but not proof or actual equipment feedback.
- Using an interval too slow to capture a short control event.
- Using an unnecessarily fast interval for months and filling buffers or overloading the system.
- Ignoring time synchronization between controllers and supervisors.
- Trusting a point with bad units, scaling, stale value, or unreliable status.
- Changing the sequence before collecting a baseline.
- Failing to document the time of manual overrides or technician tests.
Facility Manager Trend Requests That Are Actually Useful
- For comfort complaints: zone temp/setpoint, occupancy, airflow or fan status, heating/cooling command.
- For pump complaints: DP actual/setpoint, pump command, actual speed, run/fault, lead/lag state.
- For AHU complaints: SAT actual/setpoint, static actual/setpoint, fan command/speed/status, valve/damper commands, safeties.
- For recurring alarms: alarm state plus the values and interlocks that should cause or prevent the alarm.
- For energy complaints: equipment enable, load, setpoints, major valve/damper positions, temperatures, and staging.
Technician Checklist
☐ Define the troubleshooting question before selecting points.
☐ Include mode/enable, setpoint, actual value, command, feedback, safety, and context as applicable.
☐ Verify units, scaling, reliability, overrides, and point mapping.
☐ Choose a trend interval appropriate to the event and platform capacity.
☐ Confirm clocks are synchronized across the devices producing the data.
☐ Record the exact time of manual tests and changes.
☐ Capture enough baseline data before making the correction.
☐ Trend after the correction to verify stable operation.
☐ Remove temporary high-resolution trends when they are no longer needed.
Key Takeaways
- A good trend tells the control story, not just the symptom.
- Setpoint + process value + command + feedback is the core relationship for many control loops.
- Mode, safety, and load context explain why the control loop changed behavior.
- Trend interval must match the speed of the problem and the capacity of the BAS.
- Trend data should prove the fix, not merely help find the fault.
FAQ
How many BAS points should I trend at once?
Enough to test the hypothesis, but not every available point. Start with the control relationship and add context only when it can explain the behavior.
Is one-minute trending always best for troubleshooting?
No. One minute can be useful for many HVAC events, but some fast loops need temporarily finer data and many long-term performance questions need much less frequent samples. Platform limits matter.
Should I use periodic trends or change-of-value trends?
It depends on the point and platform. Change-of-value can be efficient for state changes or values that update meaningfully on change; periodic sampling is often easier to compare for continuously varying process data. Follow the BAS manufacturer’s guidance.
What is the most important trend for a VFD-controlled pump?
Trend differential-pressure setpoint and actual, BAS speed command, actual drive speed/frequency, run/fault state, and the sequence context such as lead/lag or critical valve demand.
Related Articles
Sources & Further Reading
- PNNL — Variable Air Volume (VAV) Systems Operations and Maintenance: Performance Monitoring
- PNNL — Building Re-Tuning Trend Data Collection Training
- Johnson Controls — Metasys Trend Extensions
- Johnson Controls — Metasys Trend Extension Attributes 16.0
- U.S. Department of Energy — Re-tuning in Federal Buildings
- ASHRAE — Guideline 36-2024 Purpose and Scope
Disclaimer: This article provides general commercial HVAC and building-automation information. Always follow manufacturer documentation, site-specific procedures, and applicable safety requirements.